Drawn in 1932 by E. Simms Campbell, this map describes the late night entertainment options available in Harlem in the early 30’s, with a special emphasis on music. Even though the map itself is loosely organized around the city blocks of Lenox and Seventh, the illustrations of musical style are not necessarily constrained by exact geographic location. The map goes to great lengths to express the culture of the Harlem music club scene; from the performers, to the dress, to the dancing, to the lingo, and even to the food. It’s a fantastic way to get a sense of the music for that neighborhood at that point in time, but more importantly to get a sense of the culture surrounding it. The full resolution version is available here.
If you’re interested in the other tube map based rock maps, you can check out Dorian Lynskey’s map for sale at the London Transport Museum Shop (I think Paul had that one on his wall at some point.) Also worth checking out is the Last.fm tube tags project that was covered here previously.
Hot of the presses, here are the sides for the tutorial that Justin and Paul are presenting at ISMIR 2009 on October 26.
Note that the live presentation will include many demonstrations and videos of visualizations that just are not practical to include in a PDF. If you have the chance, be sure to check out the tutorial at ISMIR in Kobe on the 26th.
MarGrid is a visualization that uses Self-Organizing Maps to organize music collections into a two-dimensional grid based on music similarity. On the MarGrid website you can use find a flash-based interface that will let you explore a 1,000 song music collection.
The MarGrid interface is incorporated into AudioScapes, a framework for prototyping and exploring how touch-based and gestural controllers can be used with state-of-the-art content and context-aware visualizations. AudioScapes provides well-defined interfaces and conventions a variety of different audio collections, controllers and visualization methods so they can be easily combined to create innovative ways of interacting with large audio collections.
Here’s an AudioScape video that shows the MarGrid in an iPhone app that is designed to to help people with disabilities navigate through their personal collections. There are more videos worth watching on the AudioScapes site.
Creator:
MarGrid and AudioScapes is a project being built by researcher Steven Ness and George Tzanetakis at the University of Victoria It is built using the venerable Marsyas audio framework
Fast Visual Music Discovery Via Locality-Sensitive Hashing
mHashup is a novel visual interface to large music collections, such as today’s million-song download services, for discovering musical relationships among tracks. Users engage in direct on-screen query and retrieval of music fragments in an instantaneous feedback flow performed by a locality sensitive hash table in secondary storage.
mHashup facilitates both professional music searches (such as musicologists and copyright lawyers seeking the origins of sampled music with location markers precisely given for each returned track) and end-user music applications (such as discovery of “dark media” by its relationship to known “hot” items). The visual/auditory display of results incorporates summaries of retrieved tracks and facilitates a user-interaction feedback cycle for refining and expanding music discovery processes. mHashup’s visual interface uses the core functionality of a content-based search engine as a visual grammar to be explored by direct manipulation.
One of the most beautiful renderings of the music space is shown in The World of Music by researchers at Standford, MIT and Yahoo!. This visualizations shows 10,000 artists and how they are related to each other. The artist relation data is mined from user ratings of artists in the Yahoo! Music service. They use a technique called semidefinite programming (which is sometimes called Semidefinite embedding) to layout and cluster the data. Semidefinite embedding is a method for mapping high dimensional data into a lower dimensional euclidean vector space.
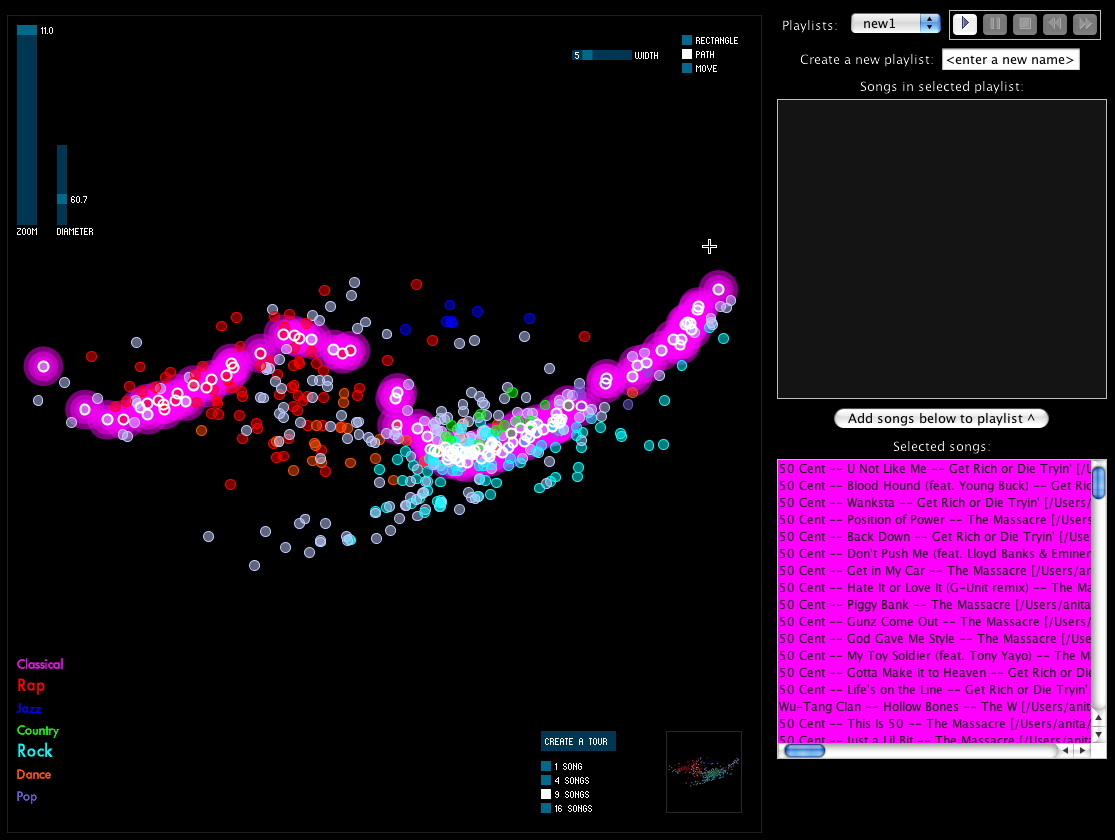
Navigating increasingly large personal music libraries is commonplace. Yet most music browsers do not enable their users to explore their collections in a guided and manipulable fashion, often requiring them to have a specific target in mind. MusicBox is a new music browser that provides this interactive control by mapping a music collection into a two-dimensional space, applying principal components analysis (PCA) to a combination of contextual and content-based features of each of the musical tracks. The resulting map shows similar songs close together and dissimilar songs farther apart. MusicBox is fully interactive and highly flexible: users can add and remove features from the included feature list, with PCA recomputed on the fly to remap the data. MusicBox is also extensible; we invite other MIR researchers to contribute features to its PCA engine. MusicBox has been shown to help users find music in their libraries, discover new music, and challenge their assumptions about relationships between types of music.
RAMA is a prototype web-based application for visualizing and interacting with networks of music artists. It uses data of roughly 200000 artists and 3 million tags, collected from Last.fm’s API. Data includes artists similarities, associated tags and popularity.
RAMA provides two simultaneous layers of information:
a graph built from artist similarity data, modeled as a physical system representing nodes as negatively charged particles and edges as springs;
overlaid labels containing user-defined tags.
A number of different features aim at providing enhanced browsing experiences to users: RAMA emphasizes commonalities as well as main differences between artists, users can interact with the graph in different ways (changing the graph’s initial ramification R, the depth D and how the ramification decays with depth, the population factor P), etc. Optionally, users can edit graphs manually, removing some artists and expanding artist’s neighbors.


